metapredict in Python
In addition to using metapredict from the command line, you can also use it directly in Python. This enables metapredict to be incorporated into your bioinformatic workflows with ease
First import metapredict:
import metapredict as meta
Once metapredict is imported, you can work with individual sequences or .fasta files. For a list of all metapredict’s public-facing functions and their documentation click here
Important updates
Update to metapredict V3 (November 2024)
In November 2024 we upated the default version of metapredict updated to be V3. V3 introduces a few new changes including increased speed for all disorder and pLDDT predictions on CPU or GPU and new networks for pLDDT and disorder prediction. The new default network for disorder prediction is V3. The new default network for pLDDT prediction is V2. Furthermore, V3 introduces simplification to our Python functionality in that predict_disorder() now offers functionality for individual predictions and batch predictions for all metapredict networks. In addition, the same functionality now applies to predict_pLDDT(), enabling massive increases in pLDDT prediction.
If a CUDA-enabled GPU is available, batch prediction will automatically use it. If not, batch prediction will fallback to CPU. While all the original functionality is preserved, predict_disorder(), offers a 5-10x speedup on CPUs and 30-40x speedup on GPUs. In addition, Apple Silicon machines can now use the MPS framework for GPU predictions.
predict_disorder() can as of v3 take in a single sequence, a list of sequences or a dictionary of sequences, and returns individual scores, a list or dictionary that maps input index back to a two-position list of sequence and disorder scores or, if return_disorder_domains is set to True, metapredict will return DisorderDomain objects.
This functionality is described in detail in the function documentation under the Python Module Documentation entry for predict_disorder().
Note - all functionanlity previously only in predict_disorder_batch() is now in predict_disorder_() for disorder prediction and :code:`predict_pLDDT for pLDDT score prediction. However, for V3 we decided to maintain backwards compaibility with V2 so the :code:`predict_disorder_batch() still works, it’s just not necessary. We plan to deprecate this functionality in the future as it is now redundant.
Predicting Disorder
The predict_disorder() function can take in an individual sequence as a string, a list of sequences, or a dictionary of sequences where the key for each sequence is the name of that sequence and the value in the dictionary is the corresponding sequence. Depending on your input, metapredict will return for single sequences: a list of predicted disorder consensus values for the residues of the input sequence, for a list of sequences: a nested list where the first value in each sublist is the sequence and the second value in each sublist is a list or numpy array of disorder values, and for a dictionary of sequences: a dictionary where the key is the name of the sequence and the value is a list where the first element in the list is the sequence and the second value in the list is a list or numpy array of disorder values.
Predicting disorder for a single sequence
meta.predict_disorder("DSSPEAPAEPPKDVPHDWLYSYVFLTHHPADFLR")
would output -
 array([0.8173, 0.8311, 0.8276, 0.8193, 0.8036, 0.7832, 0.7485, 0.708 ,
0.6778, 0.64  , 0.5948, 0.5439, 0.5062, 0.47  , 0.448 , 0.4356,
0.412 , 0.3687, 0.3294, 0.2986, 0.2724, 0.2543, 0.238 , 0.227 ,
0.2185, 0.2084, 0.1846, 0.1665, 0.1559, 0.1373, 0.124 , 0.1133,
0.0958, 0.0738], dtype=float32)
Predicting disorder for a list of sequences
sequences=['GSGSGSGSSGSGSGS', 'DSSPEAPAEPPKDVPHDWLYSYVFLTHHPADFLR']
meta.predict_disorder(sequences)
would output -
  [['GSGSGSGSSGSGSGS', array([0.8916, 0.9393, 0.9505, 0.9596, 0.9618, 0.9639, 0.9623, 0.9589,
 0.9517, 0.9371, 0.917 , 0.8955, 0.8827, 0.8773, 0.8686],
dtype=float32)], ['DSSPEAPAEPPKDVPHDWLYSYVFLTHHPADFLR', array([0.8173, 0.8311, 0.8276, 0.8193, 0.8036, 0.7832, 0.7485, 0.708 ,
 0.6778, 0.64  , 0.5948, 0.5439, 0.5062, 0.47  , 0.448 , 0.4356,
 0.412 , 0.3687, 0.3294, 0.2986, 0.2724, 0.2543, 0.238 , 0.227 ,
 0.2185, 0.2084, 0.1846, 0.1665, 0.1559, 0.1373, 0.124 , 0.1133,
 0.0958, 0.0738], dtype=float32)]]
Predicting dictionaries of sequences
sequences={'seq1':'GSGSGSGSSGSGSGS', 'seq2':'DSSPEAPAEPPKDVPHDWLYSYVFLTHHPADFLR'}
meta.predict_disorder(sequences)
would output -
  {'seq1': ['GSGSGSGSSGSGSGS', array([0.8916, 0.9393, 0.9505, 0.9596, 0.9618, 0.9639, 0.9623, 0.9589,
 0.9517, 0.9371, 0.917 , 0.8955, 0.8827, 0.8773, 0.8686],
dtype=float32)], 'seq2': ['DSSPEAPAEPPKDVPHDWLYSYVFLTHHPADFLR', array([0.8173, 0.8311, 0.8276, 0.8193, 0.8036, 0.7832, 0.7485, 0.708 ,
 0.6778, 0.64  , 0.5948, 0.5439, 0.5062, 0.47  , 0.448 , 0.4356,
 0.412 , 0.3687, 0.3294, 0.2986, 0.2724, 0.2543, 0.238 , 0.227 ,
 0.2185, 0.2084, 0.1846, 0.1665, 0.1559, 0.1373, 0.124 , 0.1133,
 0.0958, 0.0738], dtype=float32)]}
Additional Usage:
Disabling prediction value normalization
By default, output prediction values are normalized between 0 and 1. However, some of the raw values from the predictor are slightly less than 0 or slightly greater than 1. The negative values are simply replaced with 0 and the values greater than 1 are replaced with 1 by default. However, you can disable this by setting normalized=False as a second argument in meta.predict_disorder(). There is not a very good reason to do this, and it is generally not recommended.
meta.predict_disorder("DSSPEAPAEPPKDVPHDWLYSYVFLTHHPADFLR", normalized=False)
Using the different versions of the metapredict network
V3 is the default metapredict network for disorder prediction. To use the original metapredict network (previously referred to as ‘legacy’, simply set version=1.
Example:
meta.predict_disorder("DSSPEAPAEPPKDVPHDWLYSYVFLTHHPADFLR", version=1)
To use the V2 metapredict network, simply set version=2.
Example:
meta.predict_disorder("DSSPEAPAEPPKDVPHDWLYSYVFLTHHPADFLR", version=2)
Selecting a specific device to use for predictions
If you are predicting a single IDR, metapredict will just use the CPU. However, if you input a list or dictionary of sequences, metapredict will see if a CUDA-enabled GPU is available to use and if one is available, metapredict will use that GPU to increase the speed of disorder prediction. However, you can ‘force’ metapredict to use one or the other if you’d like. You can also specify a GPU if you have multiple available. In addition, if you are using MacOS and an Apple Silicon computer, you can use a Mac GPU using the MPS framework. Metapredict will not do this automatically because mps is still under development.
Example - predicting on CPU:
sequences=['GSGSGSGSSGSGSGS', 'DSSPEAPAEPPKDVPHDWLYSYVFLTHHPADFLR']
meta.predict_disorder(sequences, device='cpu')
Example - predicting on CUDA-enabled GPU:
sequences=['GSGSGSGSSGSGSGS', 'DSSPEAPAEPPKDVPHDWLYSYVFLTHHPADFLR']
meta.predict_disorder(sequences, device='cuda')
Example - predicting on first CUDA-enabled GPU:
sequences=['GSGSGSGSSGSGSGS', 'DSSPEAPAEPPKDVPHDWLYSYVFLTHHPADFLR']
meta.predict_disorder(sequences, device=0)
Example - predicting on MacOS GPU (MPS):
sequences=['GSGSGSGSSGSGSGS', 'DSSPEAPAEPPKDVPHDWLYSYVFLTHHPADFLR']
meta.predict_disorder(sequences, device='mps')
Returning a list instead of a np.array
By default, metapredict will return a numpy array of predicted disorder values. However, if you would like to return a list instead, you can specify return_numpy=False.
Example - returning a list:
sequences=['GSGSGSGSSGSGSGS', 'DSSPEAPAEPPKDVPHDWLYSYVFLTHHPADFLR']
meta.predict_disorder(sequences, return_numpy=False)
Predicting disorder domains
You previously had to use the predict_disorder_domains() function to get a DisorderObject returned. Now you can just use predict_disorder() and set return_domains=True.
The DisorderObject has 6 dot variables that can be called to get information about your input sequence. They are as follows:
- .sequencestr
Amino acid sequence
- .disorderlist or np.ndaarray
Hybrid disorder score
- .disordered_domain_boundarieslist
List of domain boundaries for IDRs using Python indexing
- .folded_domain_boundarieslist
List of domain boundaries for folded domains using Python indexing
- .disordered_domainslist
List of the actual sequences for IDRs
- .folded_domainslist
List of the actual sequences for folded domains
Example - predicting disorder domains:
sequences=['GSGSGSGSSGSGSGS', 'DSSPEAPAEPPKDVPHDWLYSYVFLTHHPADFLR']
meta.predict_disorder(sequences, return_domains=True)
For DisorderObjects, you can also specify the disorder_threshold (default is the default value for your chosen network), minimum_IDR_size (default=12), minimum_folded_domain (default=50), gap_closure (default=10), and override_folded_domain_minsuze (default=False).
minimum_IDR_size: The shortest length of a possible IDR.
minimum_folded_domain: The shortest length of a possible folded domain. This is NOT a hard limit and functions to modulate the removal of large gaps (i.e. gaps less than this size are treated less strictly).
gap_closure: The largest gap that would be closed. Gaps here refer to a scenario in which you have two groups of disordered residues separated by a ‘gap’ of not disordered residues. In general large gap sizes will favor larger contiguous IDRs.
override_folded_domain_minsize: If you want to override the default minimum folded domain size, you can set this to a value. Basically a failsafe check that assumes folded domains shouldn’t be less than 35 or 20 residues.
disorder_threshold: The disorder threshold for the prediction. The higher the threshold value, the more conservative metapredict will be for designating a region as disordered.
Additional options when using predict_disorder() -
Additional options whenusing predict_disorder() are:
print_performance: If you want to see the performance of the prediction, you can set this to True.
show_progress_bar: If you want to see the progress of the predictions, you can set this to True. This will make a progress bar appear when doing predictions.
force_disable_batch: Allows you to disable batch predictions. This is mainly for debugging.
disable_pack_n_pad: Allows disabling of the packing and padding of sequences. This is mainly for debugging.
silence_warnings: If you want to silence warnings, you can set this to True.
legacy: if you want to use legacy metapredict, you can setlegacy=Trueinstead of specifyingversion. This is primarily for backwards compatibility.
Predicting AlphaFold2 Confidence Scores
The predict_pLDDT() function now works similar to the predict_disorder() function. It can now take in an individual sequence as a string, a list of sequences, or a dictionary of sequences where the key for each sequence is the name of that sequence and value in the dictionary is the corresponding sequence. Depending on your input, metapredict will return for single sequences: a list of predicted pLDDT scores for the residues of the input sequence, for a list of sequences: a nested list where the first value in each sublist is the sequence and the second value in each sublist is a list or numpy array of pLDDT scores, and for a dictionary of sequences: a dictionary where the key is the name of the sequence and the value is a list where the first element in the list is the sequence and the second value in the list is a list or numpy array of pLDDT scores.
Single sequence predictions using meta.predict_pLDDT()
Running -
meta.predict_pLDDT("DSSPEAPAEPPKDVPHDWLYSYVFLTHHPADFLR")
would output -
  array([28.6362, 28.5554, 28.2763, 33.8679, 32.6974, 33.338 , 39.2978,
 37.1473, 39.7755, 46.9065, 50.3769, 49.509 , 55.191 , 53.0317,
 57.9838, 56.5801, 60.6751, 59.5257, 64.2864, 67.5473, 69.8021,
 70.2081, 72.7588, 75.1032, 76.5738, 77.5005, 77.7688, 78.1601,
 79.7701, 80.8347, 80.2206, 85.2205, 88.1094, 92.1518],
dtype=float32)
Predicting lists of sequences using meta.predict_pLDDT()
Running -
sequences=['GSGSGSGSSGSGSGS', 'DSSPEAPAEPPKDVPHDWLYSYVFLTHHPADFLR']
meta.predict_pLDDT(sequences)
would output -
  [['GSGSGSGSSGSGSGS', array([22.5567, 22.9878, 23.96  , 23.4159, 24.7142, 24.7988, 26.3124,
 27.5982, 29.0002, 31.5604, 33.7347, 38.4765, 43.2199, 49.3181,
 56.6075], dtype=float32)], ['DSSPEAPAEPPKDVPHDWLYSYVFLTHHPADFLR', array([28.6362, 28.5554, 28.2763, 33.8679, 32.6974, 33.338 , 39.2978,
 37.1473, 39.7755, 46.9065, 50.3769, 49.509 , 55.191 , 53.0317,
 57.9838, 56.5801, 60.6751, 59.5257, 64.2864, 67.5473, 69.8021,
 70.2081, 72.7588, 75.1032, 76.5738, 77.5005, 77.7688, 78.1601,
 79.7701, 80.8347, 80.2206, 85.2205, 88.1094, 92.1518],
dtype=float32)]]
Predicting dictionaries of sequences using meta.predict_pLDDt()
Running -
sequences={'seq1':'GSGSGSGSSGSGSGS', 'seq2':'DSSPEAPAEPPKDVPHDWLYSYVFLTHHPADFLR'}
meta.predict_pLDDT(sequences)
would output -
  {'seq1': ['GSGSGSGSSGSGSGS', array([22.5567, 22.9878, 23.96  , 23.4159, 24.7142, 24.7988, 26.3124,
 27.5982, 29.0002, 31.5604, 33.7347, 38.4765, 43.2199, 49.3181,
 56.6075], dtype=float32)], 'seq2': ['DSSPEAPAEPPKDVPHDWLYSYVFLTHHPADFLR', array([28.6362, 28.5554, 28.2763, 33.8679, 32.6974, 33.338 , 39.2978,
 37.1473, 39.7755, 46.9065, 50.3769, 49.509 , 55.191 , 53.0317,
 57.9838, 56.5801, 60.6751, 59.5257, 64.2864, 67.5473, 69.8021,
 70.2081, 72.7588, 75.1032, 76.5738, 77.5005, 77.7688, 78.1601,
 79.7701, 80.8347, 80.2206, 85.2205, 88.1094, 92.1518],
dtype=float32)]}
Additional Usage:
Disabling prediction value normalization
By default, output prediction values are normalized between 0 and 1. You can remove normalization by specifying normalized=False as a second argument in meta.predict_pLDDT().
meta.predict_pLDDT("DSSPEAPAEPPKDVPHDWLYSYVFLTHHPADFLR", normalized=False)
Using the different versions of the metapredict pLDDT network
V2 is the default metapredict network for pLDDT prediction. To use the original pLDDT prediction network (previously referred to as ‘alphaPredict’), simply set pLDDT_version=1.
Example:
meta.predict_pLDDT("DSSPEAPAEPPKDVPHDWLYSYVFLTHHPADFLR", pLDDT_version=1)
Selecting a specific device to use for predictions
If you are predicting a single pLDDT score, metapredict will just use the CPU. However, if you input a list or dictionary of sequences, metapredict will see if a CUDA-enabled GPU is available to use and if one is available, metapredict will use that GPU to increase the speed of pLDDT prediction. However, you can ‘force’ metapredict to use one or the other if you’d like. You can also specify a GPU if you have multiple available. In addition, if you are using MacOS and an Apple Silicon computer, you can use a Mac GPU using the MPS framework. Metapredict will not do this automatically because mps is still under development.
Example - predicting pLDDT scores on CPU:
sequences=['GSGSGSGSSGSGSGS', 'DSSPEAPAEPPKDVPHDWLYSYVFLTHHPADFLR']
meta.predict_pLDDT(sequences, device='cpu')
Example - predicting on CUDA-enabled GPU:
sequences=['GSGSGSGSSGSGSGS', 'DSSPEAPAEPPKDVPHDWLYSYVFLTHHPADFLR']
meta.predict_pLDDT(sequences, device='cuda')
Example - predicting on first CUDA-enabled GPU:
sequences=['GSGSGSGSSGSGSGS', 'DSSPEAPAEPPKDVPHDWLYSYVFLTHHPADFLR']
meta.predict_pLDDT(sequences, device=0)
Example - predicting on MacOS GPU (MPS):
sequences=['GSGSGSGSSGSGSGS', 'DSSPEAPAEPPKDVPHDWLYSYVFLTHHPADFLR']
meta.predict_pLDDT(sequences, device='mps')
Returning a list instead of a np.array
By default, metapredict will return a numpy array of predicted disorder values. However, if you would like to return a list instead, you can specify return_numpy=False.
Example - returning a list:
sequences=['GSGSGSGSSGSGSGS', 'DSSPEAPAEPPKDVPHDWLYSYVFLTHHPADFLR']
meta.predict_pLDDT(sequences, return_numpy=False)
Predicting Disorder Domains:
The predict_disorder_domains() function takes in an amino acid sequence and returns a DisorderObject. The DisorderObject has 6 dot variables that can be called to get information about your input sequence. They are as follows:
- .sequencestr
Amino acid sequence
- .disorderlist or np.ndaarray
Hybrid disorder score
- .disordered_domain_boundarieslist
List of domain boundaries for IDRs using Python indexing
- .folded_domain_boundarieslist
List of domain boundaries for folded domains using Python indexing
- .disordered_domainslist
List of the actual sequences for IDRs
- .folded_domainslist
List of the actual sequences for folded domains
seq = meta.predict_disorder_domains("MKAPSNGFLPSSNEGEKKPINSQLWHACAGPLVSLPPVGSLVVYFPQGHSEQVAASMQKQTDFIPNYPNLPSKLICLLHS")
Now we can call the various dot values for seq.
Getting the sequence
print(seq.sequence)
returns
MKAPSNGFLPSSNEGEKKPINSQLWHACAGPLVSLPPVGSLVVYFPQGHSEQVAASMQKQTDFIPNYPNLPSKLICLLHS
Getting the disorder scores
print(seq.disorder)
returns
[0.922  0.9223 0.9246 0.9047 0.8916 0.8956 0.8931 0.883  0.8613 0.8573
0.852  0.8582 0.8614 0.8455 0.826  0.7974 0.7616 0.7248 0.6782 0.6375
0.5886 0.5476 0.5094 0.4774 0.4472 0.4318 0.4266 0.4222 0.3953 0.3993
0.3904 0.4004 0.3962 0.3721 0.3855 0.3582 0.3456 0.3682 0.3488 0.3274
0.3258 0.2937 0.2864 0.3004 0.3358 0.3815 0.4397 0.4594 0.4673 0.4535
0.4446 0.4481 0.4546 0.4454 0.4549 0.4564 0.4677 0.4539 0.4713 0.49
0.4934 0.4835 0.4815 0.4692 0.4548 0.4856 0.495  0.4809 0.502  0.4944
0.4612 0.4561 0.436  0.4203 0.3784 0.3624 0.3739 0.3983 0.4348 0.4369]
Getting the disorder domain boundaries
print(seq.disordered_domain_boundaries)
returns
[[0, 23]]
Where each nested list is the boundaries for a specific disordered region and the first element in each list is the start of that region and the second element is the end of that region.
Getting the folded domain boundaries
print(seq.folded_domain_boundaries)
returns
[[23, 80]]
Where each nested list is the boundaries for a specific folded region and the first element in each list is the start of that region and the second element is the end of that region.
Getting the disordered domain sequences
print(seq.disordered_domains)
returns
['MKAPSNGFLPSSNEGEKKPINSQ']
Where each element in the list is a specific disordered region identified in the sequence.
Getting the folded domain sequences
print(seq.folded_domains)
returns
['LWHACAGPLVSLPPVGSLVVYFPQGHSEQVAASMQKQTDFIPNYPNLPSKLICLLHS']
Where each element in the list is a specific folded region identified in the sequence.
Additional Usage:
Altering the disorder theshhold
To alter the disorder threshold, simply set disorder_threshold=my_value where my_value is a float. The higher the threshold value, the more conservative metapredict will be for designating a region as disordered. Default = 0.5 (V3, V2) and 0.42 (legacy / V1).
Example
meta.predict_disorder_domains("MKAPSNGFLPSSNEGEKKPINSQLWHACAGPLV", disorder_threshold=0.3)
Altering minimum IDR size
The minimum IDR size will define the smallest possible region that could be considered an IDR. In other words, you will not be able to get back an IDR smaller than the defined size. Default is 12.
Example
meta.predict_disorder_domains("MKAPSNGFLPSSNEGEKKPINSQLWHACAGPLV", minimum_IDR_size = 10)
Altering the minimum folded domain size
The minimum folded domain size defines where we expect the limit of small folded domains to be. NOTE this is not a hard limit and functions more to modulate the removal of large gaps. In other words, gaps less than this size are treated less strictly. Note that, in addition, gaps < 35 are evaluated with a threshold of 0.35 x disorder_threshold and gaps < 20 are evaluated with a threshold of 0.25 x disorder_threshold. These two length-scales were decided based on the fact that coiled-coiled regions (which are IDRs in isolation) often show up with reduced apparent disorder within IDRs but can be as short as 20-30 residues. The folded_domain_threshold is used based on the idea that it allows a ‘shortest reasonable’ folded domain to be identified. Default=50.
Example
meta.predict_disorder_domains("MKAPSNGFLPSSNEGEKKPINSQLWHACAGPLV", minimum_folded_domain = 60)
Altering gap_closure
The gap closure defines the largest gap that would be closed. Gaps here refer to a scenario in which you have two groups of disordered residues separated by a ‘gap’ of not disordered residues. In general large gap sizes will favor larger contiguous IDRs. It’s worth noting that gap_closure becomes relevant only when minimum_region_size becomes very small (i.e. < 5) because really gaps emerge when the smoothed disorder fit is “noisy”, but when smoothed gaps are increasingly rare. Default=10.
Example
meta.predict_disorder_domains("MKAPSNGFLPSSNEGEKKPINSQLWHACAGPLV", gap_closure = 5)
Using a specific metapredict network
To use the original metapredict network, simply set version=1. You can use V2 by specifying version=2.
Example:
meta.predict_disorder_domains("MKAPSNGFLPSSNEGEKKPINSQLWHACAGPLV", version=1)
Calculating Percent Disorder:
The percent_disorder() function will return the percent of residues in a sequence that are predicted to be disordered.
meta.percent_disorder("DSSPEAPAEPPKDVPHDWLPYSYVFGLGTPHGHPPADFGLR")
would output -
95.122
Additional Usage:
Specifying mode
Percent_disorder() has two modes defined by the mode keyword: threshold and disorder_domains.
The default usage is with the threshold mode. In this case, each residue is evaluated against a threshold value, where disorder scores above that threshold count towards disordered residues. This mode uses a threshold value of 0.5 (for V2) or 0.3 (for legacy / V1), although the threshold can be changed (see below).
The alternative mode, disorder_domains, makes use of metapredict’s predict_disorder_domains() functionality. Now, the sequence is divided up into IDRs and folded domains, and then the percentage disordered is based on what fraction of residues fall into IDRs. The underlying disorder domain prediction uses the default disorder thresholds as per the predict_disorder_domains() function, but this can be over-ridden if a disorder_threshold keyword is passed. For example:
meta.percent_disorder("DSSPEAPAEPPKDVPHDWLPYSYVFGLGTPHGHPPADFGLR", mode='disorder_domains')
would output -
100.0
because the short ‘folded’ region where residue have a disorder score below the threshold are incorporated into the IDR in the predict_disorder_domains() function.
Changing the cutoff value
If you want to be more strict in what you consider to be disordered for calculating percent disorder of an input sequence, you can simply specify the cutoff value by adding the argument cutoff=<value> where the <value> corresponds to the percent (expressed as a fraction) you would like to use as the cutoff (for example, 0.8 would be 80%).
Example:
meta.percent_disorder("DSSPEAPAEPPKDVPHDWLYSYVFLTHHPADFLR", disorder_threshold= 0.8)
would output
14.706
The higher the cutoff value, the higher the value any given predicted residue must be greater than or equal to in order to be considered disordered when calculating the final percent disorder for the input sequence.
Specifying metapredict networks
To use other metapredict network, simply set version=1 to use legacy metapredict and version=2 to use V2.
Example:
meta.percent_disorder("DSSPEAPAEPPKDVPHDWLYSYVFLTHHPADFLR", disorder_threshold= 0.8, version=1)
would output
29.412
Graphing Disorder
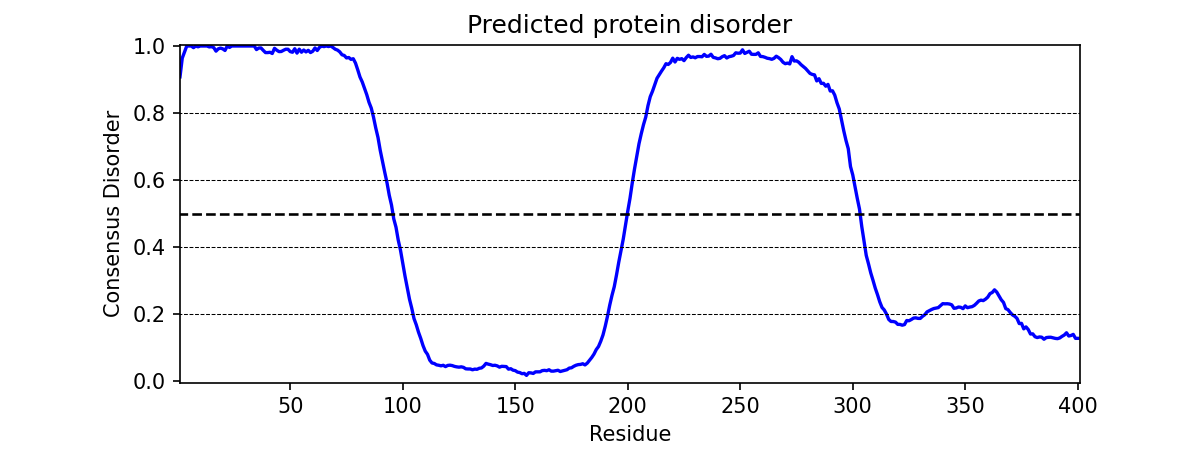
The graph_disorder() function will show a plot of the predicted disorder consensus values across the input amino acid sequence. Running -
meta.graph_disorder("GHPGKQRNPGEHHSSRNVKRNWNNSPSGPNEGRESQEERKTPPRRGGQQSGESHNQDETNKPNPSDNHHEEEKADDNAHRGNDSSPEAPAEPPKDVPHDWLYSYVFLTHHPADFLRAKRVLRENFVQCEKAWHRRRLAHPYNRINMQWLDVFDGDCWLAPQLCFGFQFGHDRPVWKIFWYHERGDLRYKLILKDHANVLNKPAHSRNARCESSAPSHDPHGNANSYDKKVTTPDPTEIKSSQESGNSNPDHSPHMPGRDMQEQPGEEPGGHPEKRLIRSKGKTDYKDNRSPRNNPSTDPEWESAHFQWSHDPNEQWLHNLGWPMRWMWQLPNPGIEPFSLNTRKKAPSWINLLYNADPCKTQDDERDCEHHMYQIQPIAPVPKIAMHYCTCFPRVHRIPC")
would output -
Additional Usage:
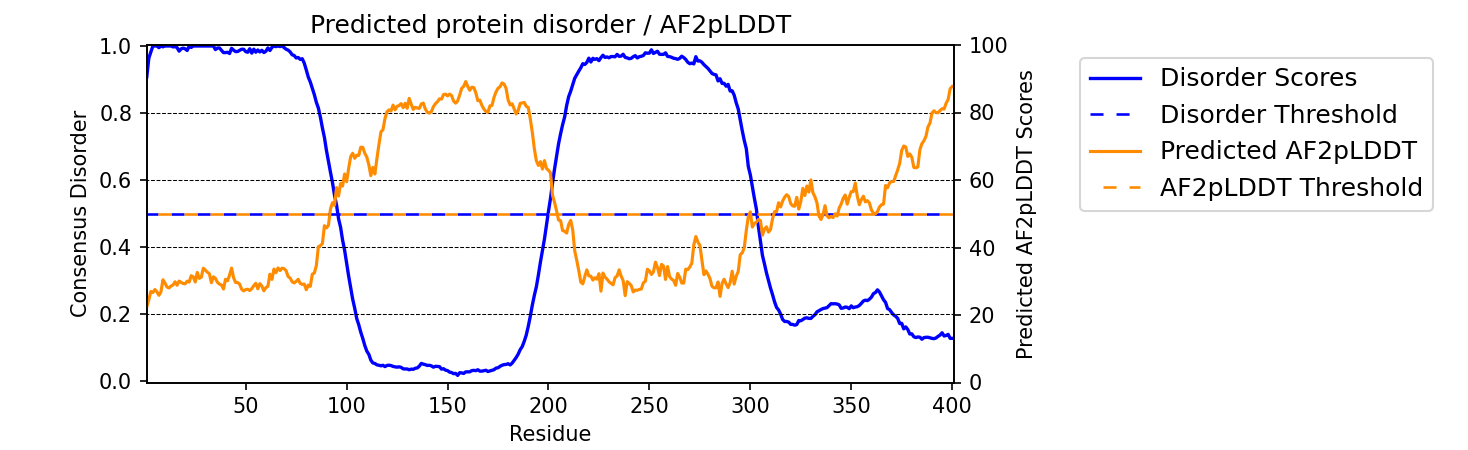
Adding Predicted AlphaFold2 Confidence Scores
To add predicted AlphaFold2 pLDDT confidence scores, simply specify pLDDT_scores=True.
Example
seq = 'GHPGKQRNPGEHHSSRNVKRNWNNSPSGPNEGRESQEERKTPPRRGGQQSGESHNQDETNKPNPSDNHHEEEKADDNAHRGNDSSPEAPAEPPKDVPHDWLYSYVFLTHHPADFLRAKRVLRENFVQCEKAWHRRRLAHPYNRINMQWLDVFDGDCWLAPQLCFGFQFGHDRPVWKIFWYHERGDLRYKLILKDHANVLNKPAHSRNARCESSAPSHDPHGNANSYDKKVTTPDPTEIKSSQESGNSNPDHSPHMPGRDMQEQPGEEPGGHPEKRLIRSKGKTDYKDNRSPRNNPSTDPEWESAHFQWSHDPNEQWLHNLGWPMRWMWQLPNPGIEPFSLNTRKKAPSWINLLYNADPCKTQDDERDCEHHMYQIQPIAPVPKIAMHYCTCFPRVHRIPC'

meta.graph_disorder(seq, pLDDT_scores=True)
would output -
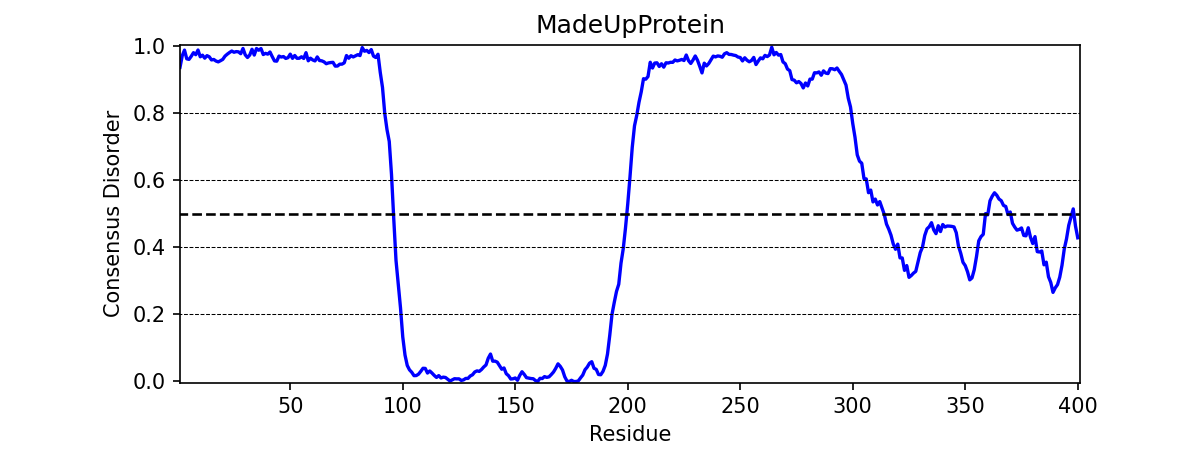
Changing title of generated graph
There are two parameters that the user can change for graph_disorder(). The first is the name of the title for the generated graph. The name by default is blank and the title of the graph is simply Predicted protein disorder. However, the title can be specified by specifying title = "my cool title" would result in a title of my cool title. Running -
meta.graph_disorder("GHPGKQRNPGEHHSSRNVKRNWNNSPSGPNEGRESQEERKTPPRRGGQQSGESHNQDETNKPNPSDNHHEEEKADDNAHRGNDSSPEAPAEPPKDVPHDWLYSYVFLTHHPADFLRAKRVLRENFVQCEKAWHRRRLAHPYNRINMQWLDVFDGDCWLAPQLCFGFQFGHDRPVWKIFWYHERGDLRYKLILKDHANVLNKPAHSRNARCESSAPSHDPHGNANSYDKKVTTPDPTEIKSSQESGNSNPDHSPHMPGRDMQEQPGEEPGGHPEKRLIRSKGKTDYKDNRSPRNNPSTDPEWESAHFQWSHDPNEQWLHNLGWPMRWMWQLPNPGIEPFSLNTRKKAPSWINLLYNADPCKTQDDERDCEHHMYQIQPIAPVPKIAMHYCTCFPRVHRIPC", title = "MadeUpProtein")
would output -
Changing the resolution of the generated graph
By default, the output graph has a DPI of 150. However, the user can change the DPI of the generated graph (higher values have greater resolution). To do so, simply specify DPI = <number> where <number is an integer.
Example:
meta.graph_disorder("DAPPTSQEHTQAEDKERD", DPI=300)
Changing the disorder threshold line
The disorder threshold line for graphs defaults to 0.42 for V1 and 0.5 for V2 and V3. However, if you want to change where the line designating the disorder cutoff is, simply specify disorder_threshold = <float> where <float> is a value between 0 and 1.
Example
meta.graph_disorder("DAPPTSQEHTQAEDKERD", disorder_threshold=0.5)
Adding shaded regions to the graph
If you would like to shade specific regions of your generated graph (perhaps shade the disordered regions), you can specify shaded_regions=[[list of regions]] where the list of regions is a list of lists that defines the regions to shade.
Example
meta.graph_disorder("DAPPTSQEHTQAEDKERDDAPPTSQEHTQAEDKERDDAPPTSQEHTQAEDKERD", shaded_regions=[[1, 20], [30, 40]])
In addition, you can specify the color of the shaded regions by specifying shaded_region_color. The default for this is red. You can specify any matplotlib color or a hex color string.
Example
meta.graph_disorder("DAPPTSQEHTQAEDKERDDAPPTSQEHTQAEDKERDDAPPTSQEHTQAEDKERD", shaded_regions=[[1, 20], [30, 40]], shaded_region_color="blue")
Saving the graph
By default, the graph will automatically appear. However, you can also save the graph if you’d like. To do this, simply specify output_file = path_where_to_save/filename.file_extension. For example, output_file=/Users/thisUser/Desktop/cool_graphs/myCoolGraph.png. You can save the file with any valid matplotlib extension (.png, .pdf, etc.).
Example
meta.graph_disorder("DAPPTSQEHTQAEDKER", output_file=/Users/thisUser/Desktop/cool_graphs/myCoolGraph.png)
Using other metapredict networks
To use other metapredict networks, simply set version=1 to use legacy metapredict (V1) and version=2 to use V2.
Example:
meta.graph_disorder("DAPPTSQEHTQAEDKER", version=1)
Graphing AlphaFold2 Confidence Scores
The graph_pLDDT() function will show a plot of the predicted AlphaFold2 pLDDT confidence scores across the input amino acid sequence.
meta.graph_pLDDT("DAPTSQEHTQAEDKERDSKTHPQKKQSPS")
Additional Usage:
This function has all of the same functionality as graph_disorder, so see that documentation for details on how you can modify the graph.
Using other metapredict pLDDT networks
To use other metapredict networks, simply set pLDDT_version=1 to use the alphaPredict pLDDT score predictor.
Example:
meta.graph_pLDDT("DAPPTSQEHTQAEDKER", pLDDT_version=1)
Predicting Disorder From a .fasta File:
By using the predict_disorder_fasta() function, you can predict disorder values for the amino acid sequences in a .fasta file. By default, this function will return a dictionary where the keys in the dictionary are the fasta headers and the values are the consensus disorder predictions of the amino acid sequence associated with each fasta header in the original .fasta file.
meta.predict_disorder_fasta("file path to .fasta file/fileName.fasta")
An actual file path would look something like:
meta.predict_disorder_fasta("/Users/thisUser/Desktop/coolSequences.fasta")
Additional Usage:
Save the output values
By default the predict_disorder_fasta function will immediately return a dictionary. However, you can also save the output to a .csv file by specifying output_file = "location you want to save the file to". When specifying the file path, you also want to specify the file name. The first cell of each row will contain a fasta header and the subsequent cells in that row will contain predicted consensus disorder values for the protein associated with the fasta header.
Example:
meta.predict_disorder_fasta("file path to .fasta file/fileName.fasta", output_file="file path where the output .csv should be saved")
An actual filepath would look something like:
meta.predict_disorder_fasta("/Users/thisUser/Desktop/coolSequences.fasta", output_file="/Users/thisUser/Desktop/cool_predictions.csv")
Get raw prediction values
By default, this function will output prediction values that are normalized between 0 and 1. However, some of the raw values from the predictor are slightly less than 0 or slightly greater than 1. The negative values are simply replaced with 0 and the values greater than 1 are replaced with 1 by default. If you want the raw values simply specify normalized=False. There is not a very good reason to do this, and it is generally not recommended. However, we wanted to give users the maximum amount of flexibility when using metapredict, so we made it an option.
Example:
meta.predict_disorder_fasta("/Users/thisUser/Desktop/coolSequences.fasta", normalized=False)
Using other metapredict networks
To use other metapredict networks, set version=1 for legacy metapredict and version=2 for v2.
Example:
meta.predict_disorder_fasta("/Users/thisUser/Desktop/coolSequences.fasta", version=1)
Predicting AlphaFold2 confidence scores From a .fasta File
Just like with predict_disorder_fasta, you can use predict_pLDDT_fasta to get predicted AlphaFold2 pLDDT confidence scores from a fasta file. All the same functionality in predict_disorder_fasta is in predict_pLDDT_fasta.
meta.predict_pLDDT_fasta("/Users/thisUser/Desktop/coolSequences.fasta")
Additional Usage:
Using other metapredict networks
To use other metapredict pLDDT networks, set pLDDT_version=1 to use the alphaPredict pLDDT score network.
Example:
meta.predict_pLDDT_fasta("/Users/thisUser/Desktop/coolSequences.fasta", pLDDT_version=1)
Predict Disorder Using Uniprot ID
By using the predict_disorder_uniprot() function, you can return predicted consensus disorder values for the amino acid sequence of a protein by specifying the UniProt ID.
meta.predict_disorder_uniprot("Q8N6T3")
Additional Usage:
Using other metapredict networks
To use other metapredict networks, set version=1 for legacy metapredict and version=2 for v2.
Example:
meta.predict_disorder_uniprot("Q8N6T3", version=1)
Predicting AlphaFold2 Confidence Scores Using Uniprot ID
By using the predict_pLDDT_uniprot function, you can generate predicted AlphaFold2 pLDDT confidence scores by inputting a UniProt ID.
meta.predict_pLDDT_uniprot('P16892')
Additional Usage:
Using other metapredict networks
To use other metapredict networks, set pLDDT_version=1 for alphaPredict pLDDT score predictions.
Example:
meta.predict_pLDDT_uniprot("Q8N6T3", pLDDT_version=1)
Generating Disorder Graphs From a .fasta File:
By using the graph_disorder_fasta() function, you can graph predicted consensus disorder values for the amino acid sequences in a .fasta file. The graph_disorder_fasta() function takes a .fasta file as input and by default will return the graphs immediately. However, you can specify output_dir=path_to_save_files which result in a .png file saved to that directory for every sequence within the .fasta file.
You cannot specify the output file name here! By default, the file name will be the first 14 characters of the FASTA header followed by the filetype as specified by filetype. If you wish for the files to include a unique leading number (i.e. X_rest_of_name where X starts at 1 and increments) then set indexed_filenames = True. This can be useful if you have sequences where the 1st 14 characters may be identical, which would otherwise overwrite an output file. By default this will return a single graph for every sequence in the FASTA file.
WARNING -
This command will generate a graph for *every* sequence in the .fasta file. If you have 1,000 sequences in a .fasta file and you do not specify the output_dir, it will generate 1,000 graphs that you will have to close sequentially. Therefore, I recommend specifying the output_dir such that the output is saved to a dedicated folder.
meta.graph_disorder_fasta("file path to .fasta file/fileName.fasta", output_dir="file path of where to save output graphs")
An actual file path would look something like:
meta.graph_disorder_fasta("/Users/thisUser/Desktop/coolSequences.fasta", output_dir="/Users/thisUser/Desktop/folderForGraphs")
Additional Usage:
Adding Predicted AlphaFold2 Confidence Scores
To add predicted AlphaFold2 pLDDT confidence scores, simply specify pLDDT_scores=True.
Example
meta.graph_disorder_fasta("/Users/thisUser/Desktop/coolSequences.fasta", pLDDT_scores=True)
Changing resolution of saved graphs
By default, the output files have a DPI of 150. However, the user can change the DPI of the output files (higher values have greater resolution but take up more space). To change the DPI, specify DPI=Number where Number is an integer.
Example:
meta.graph_disorder_fasta("/Users/thisUser/Desktop/coolSequences.fasta", DPI=300, output_dir="/Users/thisUser/Desktop/folderForGraphs")
Changing the output file type
By default the output file is a .png. However, you can specify the output file type by using output_filetype="file_type", where file_type is some matplotlib compatible file type (such as .pdf).
Example
meta.graph_disorder_fasta("/Users/thisUser/Desktop/coolSequences.fasta", output_dir="/Users/thisUser/Desktop/folderForGraphs", output_filetype = "pdf")
Indexing generated files
If you would like to index the file names with a leading unique integer starting at 1, set indexed_filenames=True.
Example
meta.graph_disorder_fasta("/Users/thisUser/Desktop/coolSequences.fasta", output_dir="/Users/thisUser/Desktop/folderForGraphs", indexed_filenames=True)
Using other metapredict networks
To use other metapredict networks, simply set version=1 for legacy metapredict and version=2 for V2.
Example:
meta.graph_disorder_fasta("/Users/thisUser/Desktop/coolSequences.fasta", output_dir="/Users/thisUser/Desktop/folderForGraphs", version=1)
Generating AlphaFold2 Confidence Score Graphs from fasta files
By using the graph_pLDDT_fasta function, you can graph predicted AlphaFold2 pLDDT confidence scores for the amino acid sequences in a .fasta file. This works the same as graph_disorder_fasta but instead returns graphs with just the predicted AlphaFold2 pLDDT scores.
meta.graph_pLDDT_fasta("/Users/thisUser/Desktop/coolSequences.fasta", output_dir="/Users/thisUser/Desktop/folderForGraphs")
Additional Usage:
Using other metapredict networks
To use other metapredict networks, simply set pLDDT_version=1 for the alphaPredict pLDDT score predictor.
Example:
meta.graph_pLDDT_fasta("/Users/thisUser/Desktop/coolSequences.fasta", output_dir="/Users/thisUser/Desktop/folderForGraphs", pLDDT_version=1)
Generating Graphs Using UniProt ID
By using the graph_disorder_uniprot() function, you can graph predicted consensus disorder values for the amino acid sequence of a protein by specifying the UniProt ID.
meta.graph_disorder_uniprot("Q8N6T3")
This function carries all of the same functionality as graph_disorder() including specifying disorder_threshold, title of the graph, the DPI, and whether or not to save the output.
Example
meta.graph_disorder_uniprot("Q8N6T3", disorder_threshold=0.5, title="my protein", DPI=300, output_file="/Users/thisUser/Desktop/my_cool_graph.png")
Additional Usage:
Adding Predicted AlphaFold2 Confidence Scores
To add predicted AlphaFold2 pLDDT confidence scores, simply specify pLDDT_scores=True.
Example
meta.graph_disorder_uniprot("Q8N6T3", pLDDT_scores=True)
Using other metapredict networks
To use other metapredict networks, simply set version=1 for legacy metapredict and version=2 for V2.
Example:
meta.graph_disorder_uniprot("Q8N6T3", version=1)
Generating AlphaFold2 Confidence Score Graphs Using UniProt ID
Just like with disorder predictions, you can also get AlphaFold2 pLDDT confidence score graphs using the Uniprot ID. This will only display the pLDDT confidence scores and not the predicted disorder scores.
meta.graph_pLDDT_uniprot("Q8N6T3")
Additional Usage:
Using other metapredict networks
To use other metapredict networks, simply set pLDDT_version=1 for the alphaPredict pLDDT score predictor.
Predicting Disorder Domains using a Uniprot ID
In addition to inputting a sequence, you can predict disorder domains by inputting a Uniprot ID by using the predict_disorder_domains_uniprot function. This function has the exact same functionality as predict_disorder_domains except you can now input a Uniprot ID. This also returns a DisorderedObject. The DisorderObject has 6 dot variables that can be called to get information about your input sequence. They are as follows:
- .sequencestr
Amino acid sequence
- .disorderlist or np.ndaarray
Hybrid disorder score
- .disordered_domain_boundarieslist
List of domain boundaries for IDRs using Python indexing
- .folded_domain_boundarieslist
List of domain boundaries for folded domains using Python indexing
- .disordered_domainslist
List of the actual sequences for IDRs
- .folded_domainslist
List of the actual sequences for folded domains
seq = meta.predict_disorder_domains_uniprot('Q8N6T3')
print(seq.disorder)
Additional Usage:
Using other metapredict networks
To use other metapredict networks, simply set version=1 for legacy metapredict and version=2 for V2.
Example:
meta.predict_disorder_domains_uniprot('Q8N6T3' version=1)
Batch prediction of disorder scores or disordered domains
As of metapredict V2-FF (V2.6), metapredict enables GPU or CPU enabled batch prediction using predict_disorder_batch(), though you can now use predict_disorder().
The simplest usage is to pass a list of sequences to predict_disorder_batch() e.g.:
seqs = ['APSPASPPASPSA','PQPQPQPWQPWPQPW','ASDASFPAPSDPASDPA']

return_data = meta.predict_disorder_batch(seqs)
In this scenario, return_data is a list of three elements, where each element is itself a list that has two elements; the sequence and the per-residue disorder scores as an np.ndarray:
[['APSPASPPASPSA',
  array([0.8983, 0.9628, 0.9682, 0.9767, 0.9798, 0.9904, 0.9774, 0.9711,
         0.9656, 0.969 , 0.9361, 0.8879, 0.7606], dtype=float32)],
 ['PQPQPQPWQPWPQPW',
  array([0.9251, 0.9448, 0.949 , 0.9393, 0.9276, 0.9132, 0.8923, 0.8575,
         0.8385, 0.8138, 0.7777, 0.7366, 0.7164, 0.6184, 0.4999],
        dtype=float32)],
 ['ASDASFPAPSDPASDPA',
  array([0.8881, 0.9427, 0.95  , 0.9415, 0.9431, 0.9336, 0.9295, 0.9304,
         0.9299, 0.9377, 0.9351, 0.9235, 0.9137, 0.9203, 0.8864, 0.83  ,
         0.7037], dtype=float32)]]
Note also that by default this function will print a progress bar to report on how quickly predictions are running. If this is not desired, the progress bar can be turned off using show_progress_bar=False option in the function signature.
In addition to passing in a list of sequences, you can also pass in a dictionary of sequences with protein_id:sequence mapping. In this case, the function will return a dictionary that has the same key-value pairing as the input dictionary, but instead of key-value (protein_id:[sequence, disorder prediction]). In this way, predicting disorder scores for large sets of sequences becomes straight forward.
Additional Usage:
Using other metapredict networks
To use other metapredict networks, simply set version=1 for legacy metapredict and version=2 for V2.
Example:
meta.predict_disorder_domains_uniprot('Q8N6T3' version=1)
Predicting disordered domains in batch mode
For disordered domains, the same function can be used with return_domains=True set. If this is the case, the same input/output behavior (lists or dictionaries as inputs) can be used, but rather than returning a two-position list of sequence and disorder score, the return type is a single DisorderDomain object.
DisorderDomain objects are data structures that present a set of information about a protein. Each object has six so-called “dot variables” (object variables) that provide distinct information:
sequence - reports on the sequence of the full protein
disorder - reports on the per-residue disorder score for the whole protein (i.e. the same information that would be reported if
return_domains=Falsedisordered_domain_boundaries - is a list with 0 or more sublists, where those sublists define the start and end positions of the IDRs within the protein sequence. These domain boundaries follow Python notation, i.e. if a disordered region ran between residue 1 and 10 in a protein, the boundaries would be [0,9].
folded_domain_boundaries - same conceptual idea as described for the disordered_domain_boundaries, except here the reciprocal folded domain boundaries are reported.
disordered_domains - the actual amino acid sequence of the IDRs - i.e. the length of disordered_domains is the same as the length of disordered_domain_boundaries.
folded_domains - the actual amino acid sequence of the folded domains - i.e. the length of folded_domains is the same as the length of folded_domain_boundaries.
As an example:
seqs = ['APSPASPPASPSA','PQPQPQPWQPWPQPW','ASDASFPAPSDPASDPA']

return_data = meta.predict_disorder_batch(seqs, return_domains=True)

# if we then examined one of the return objects
tmp = return_data[0]

print(tmp)

        DisorderObject for sequence with 13 residues, 1 IDRs, and 0 folded domains
        Available dot variables are:
          .sequence
          .disorder
          .disordered_domain_boundaries
          .folded_domain_boundaries
          .disordered_domains
          .folded_domains

print(tmp.disordered_domains)
        ['APSPASPPASPSA']

print(disorder)
        [0.8983 0.9628 0.9682 0.9767 0.9798 0.9904 0.9774 0.9711 0.9656                 0.969 0.9361 0.8879 0.7606]
The various options for changing the definition of a disordered domain are also available to be passed to meta.predict_disorder_batch(). For a complete list of possible input variables we recommend checking out the corresponding Python module documentation.
Using other metapredict networks
To use other metapredict networks, simply set version=1 for legacy metapredict and version=2 for V2.
Example:
meta.predict_disorder_domains_uniprot('Q8N6T3' version=1)
Predicting Disorder Domains from external scores
The predict_disorder_domains_from_external_scores() function takes in an disorder scores, an amino acid sequence (optinally), and returns a DisorderObject. This function lets you use other disorder predictor scores and still use the predict_disorder_domains() functionality. The DisorderObject has 6 dot variables that can be called to get information about your input sequence. They are as follows:
- .sequencestr
Amino acid sequence
- .disorderlist or np.ndaarray
Hybrid disorder score
- .disordered_domain_boundarieslist
List of domain boundaries for IDRs using Python indexing
- .folded_domain_boundarieslist
List of domain boundaries for folded domains using Python indexing
- .disordered_domainslist
List of the actual sequences for IDRs
- .folded_domainslist
List of the actual sequences for folded domains
seq = meta.predict_disorder_domains_from_external_scores(disorder=[0.8577, 0.9313, 0.9313, 0.9158, 0.8985, 0.8903, 0.8895, 0.869, 0.8444, 0.8594, 0.8643, 0.8605, 0.8697, 0.8627, 0.8641, 0.8633, 0.8487, 0.8512, 0.8236, 0.8079, 0.8047, 0.8021, 0.7954, 0.7867, 0.7797, 0.7982, 0.7842, 0.7614, 0.7931, 0.8166, 0.8298, 0.8222, 0.8227, 0.8183, 0.8279, 0.838, 0.8535, 0.8512, 0.8464, 0.8469, 0.8322, 0.8265, 0.794, 0.7827, 0.7699, 0.7575, 0.7178, 0.5988], sequence = 'MKAPSNGFLPSSNEGEKKPINSQLMKAPSNGFLPSSNEGEKKPINSQL')
Now we can call the various dot values for seq.
Getting the sequence
print(seq.sequence)
returns
MKAPSNGFLPSSNEGEKKPINSQLMKAPSNGFLPSSNEGEKKPINSQL
Getting the disorder scores
print(seq.disorder)
Getting the disorder domain boundaries
print(seq.disordered_domain_boundaries)
Getting the folded domain boundaries
print(seq.folded_domain_boundaries)
Getting the disordered domain sequences
print(seq.disordered_domains)
Getting the folded domain sequences
print(seq.folded_domains)
Additional Usage:
Altering the disorder threshold
To alter the disorder threshold, simply set disorder_threshold=my_value where my_value is a float. The higher the threshold value, the more conservative metapredict will be for designating a region as disordered. Default = 0.42
Example
meta.predict_disorder_domains_from_external_scores("MKAPSNGFLPSSNEGEKKPINSQLWHACAGPLV", disorder_threshold=0.3)
Altering minimum IDR size
The minimum IDR size will define the smallest possible region that could be considered an IDR. In other words, you will not be able to get back an IDR smaller than the defined size. Default is 12.
Example
meta.predict_disorder_domains_from_external_scores("MKAPSNGFLPSSNEGEKKPINSQLWHACAGPLV", minimum_IDR_size = 10)
Altering the minimum folded domain size
The minimum folded domain size defines where we expect the limit of small folded domains to be. NOTE this is not a hard limit and functions more to modulate the removal of large gaps. In other words, gaps less than this size are treated less strictly. Note that, in addition, gaps < 35 are evaluated with a threshold of 0.35 x disorder_threshold and gaps < 20 are evaluated with a threshold of 0.25 x disorder_threshold. These two lengthscales were decided based on the fact that coiled-coiled regions (which are IDRs in isolation) often show up with reduced apparent disorder within IDRs but can be as short as 20-30 residues. The folded_domain_threshold is used based on the idea that it allows a ‘shortest reasonable’ folded domain to be identified. Default=50.
Example
meta.predict_disorder_domains_from_external_scores("MKAPSNGFLPSSNEGEKKPINSQLWHACAGPLV", minimum_folded_domain = 60)
Altering gap_closure
The gap closure defines the largest gap that would be closed. Gaps here refer to a scenario in which you have two groups of disordered residues seprated by a ‘gap’ of not disordered residues. In general large gap sizes will favour larger contiguous IDRs. It’s worth noting that gap_closure becomes relevant only when minimum_region_size becomes very small (i.e. < 5) because really gaps emerge when the smoothed disorder fit is “noisy”, but when smoothed gaps are increasingly rare. Default=10.
Example
meta.predict_disorder_domains_from_external_scores("MKAPSNGFLPSSNEGEKKPINSQLWHACAGPLV", gap_closure = 5)